Back to the shelf

014

BidCraft Intelligence

Turns raw bidding and procurement data into interactive charts, filterable tables, and a world map of win rates.

Launched · Started September 2025 · Web App · Vibe-Coded

That's the whole thing.

The site's sound is off. The narration still plays.

This reading didn't load. The transcript is below.

Read the transcript

The data was there. Every bid, every region, every outcome. But it lived in spreadsheets and scattered reports. Pulling a trend took hours nobody had.

I had already built BidCraft for tender strategy. The analytical side was still manual. That gap was the start of BidCraft Intelligence.

I built it in September twenty twenty-five, vibe-coded with AI, in HTML, CSS, JavaScript, and Chart.js. It takes raw bidding and procurement data and turns it into interactive charts, summary cards, and filterable tables. Drill down by region, product, time period, or bid status. A world map shows win rates.

The aim: turn hours of analysis into instant clarity, so decisions rest on data. It launched. Take a look.

Narrated in my own cloned voice, generated with ElevenLabs v4.

The data was there. It lived in spreadsheets and scattered reports, and spotting a trend meant hours of pulling things together by hand before anyone could act on it.

I had already built BidCraft for tender strategy. That gave teams a way to work through each bid. The analytical side was still manual. Trends were hard to spot, and patterns across regions or products took time to surface. That gap was the start of BidCraft Intelligence.

It takes raw bidding and procurement data and turns it into interactive charts, summary cards and filterable tables. You can drill down by region, product, time period and bid status. A world map shows win rates at a glance. The data connects to live endpoints, with a mock-data fallback when needed.

The aim: turn hours of manual analysis into instant clarity, so bidding decisions rest on data.

I built it in HTML, CSS, JavaScript and Chart.js, on my C.L.E.A.R. design system. Vibe-coded with AI, starting September 2025. It’s launched, as an internal tool, so there’s no public link.

The making

  • HTML
  • CSS
  • JavaScript

01 · The problem

Before it existed

What hurt

Bidding data sat in spreadsheets and scattered reports. Spotting a trend took hours of pulling things together by hand.

Who uses it

  • Bidding team leads
  • International business managers
  • Management
  • 9chart and map panels
  • 5filters to narrow a view
  • 5API endpoints specified

02 · The flow

5 steps, in the order they happen

  1. 01 / 05

    Open the dashboard

    You
    Opens one page
    It answers
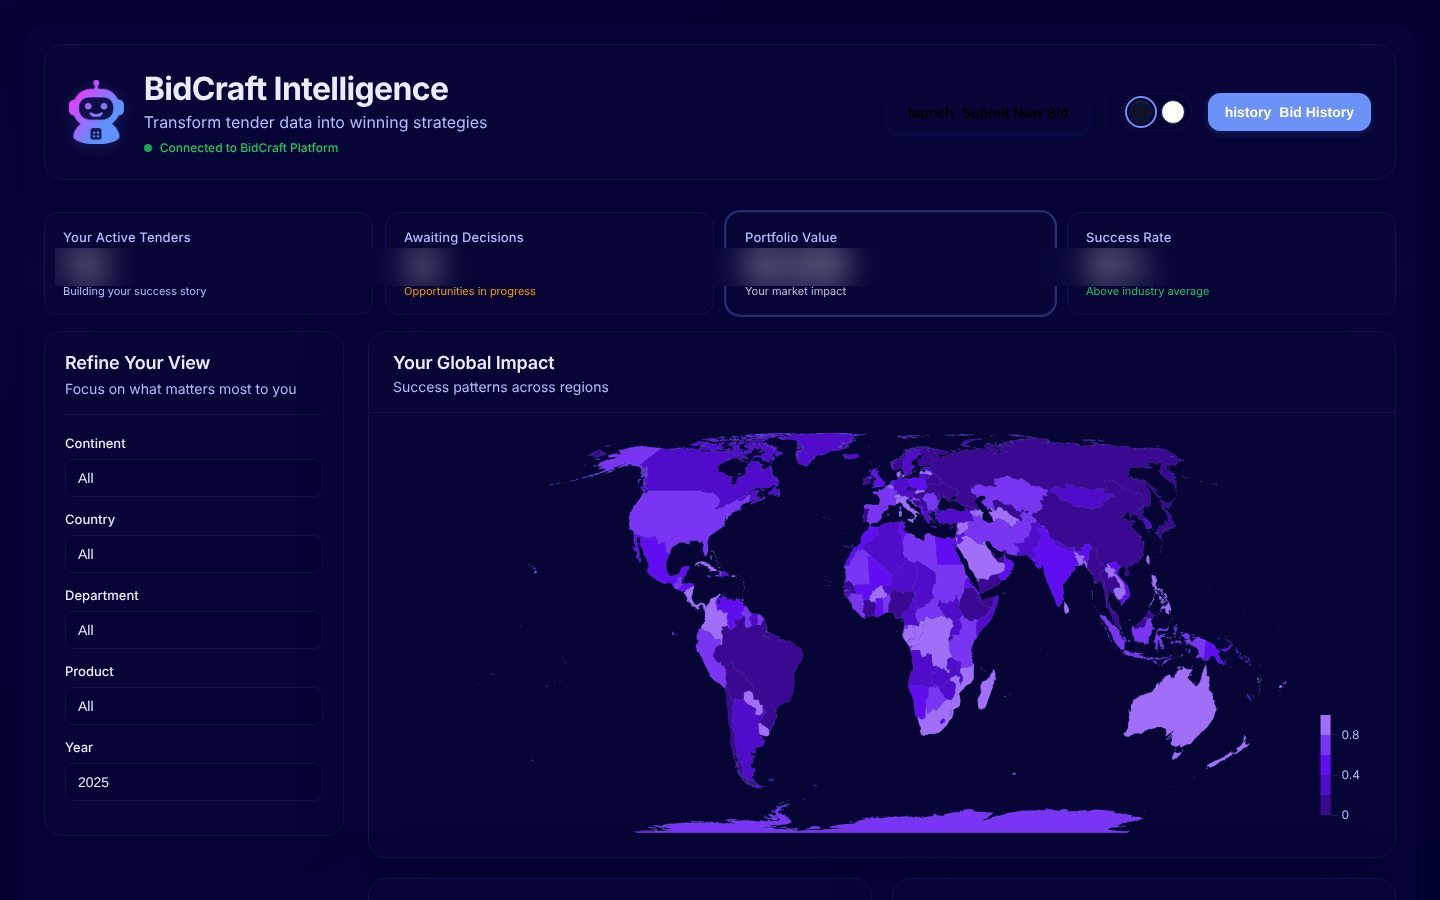
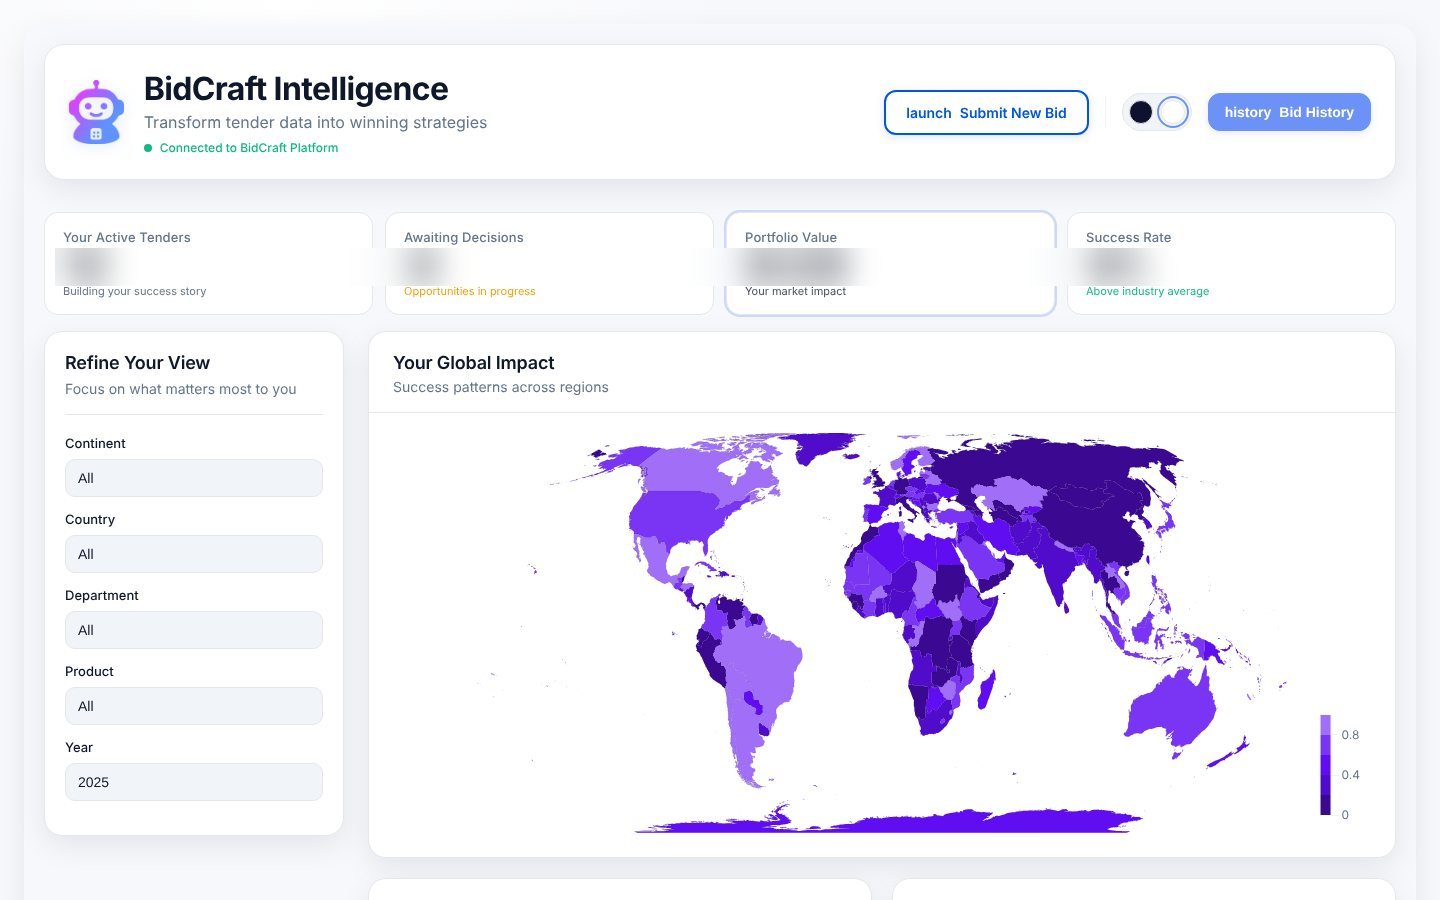
    Shows four headline numbers, five filters and a world map of win rates
    Dashboard with four summary cards, a filter panel and a purple world map
  2. 02 / 05

    Spot the patterns

    You
    Reads the charts below the map
    It answers
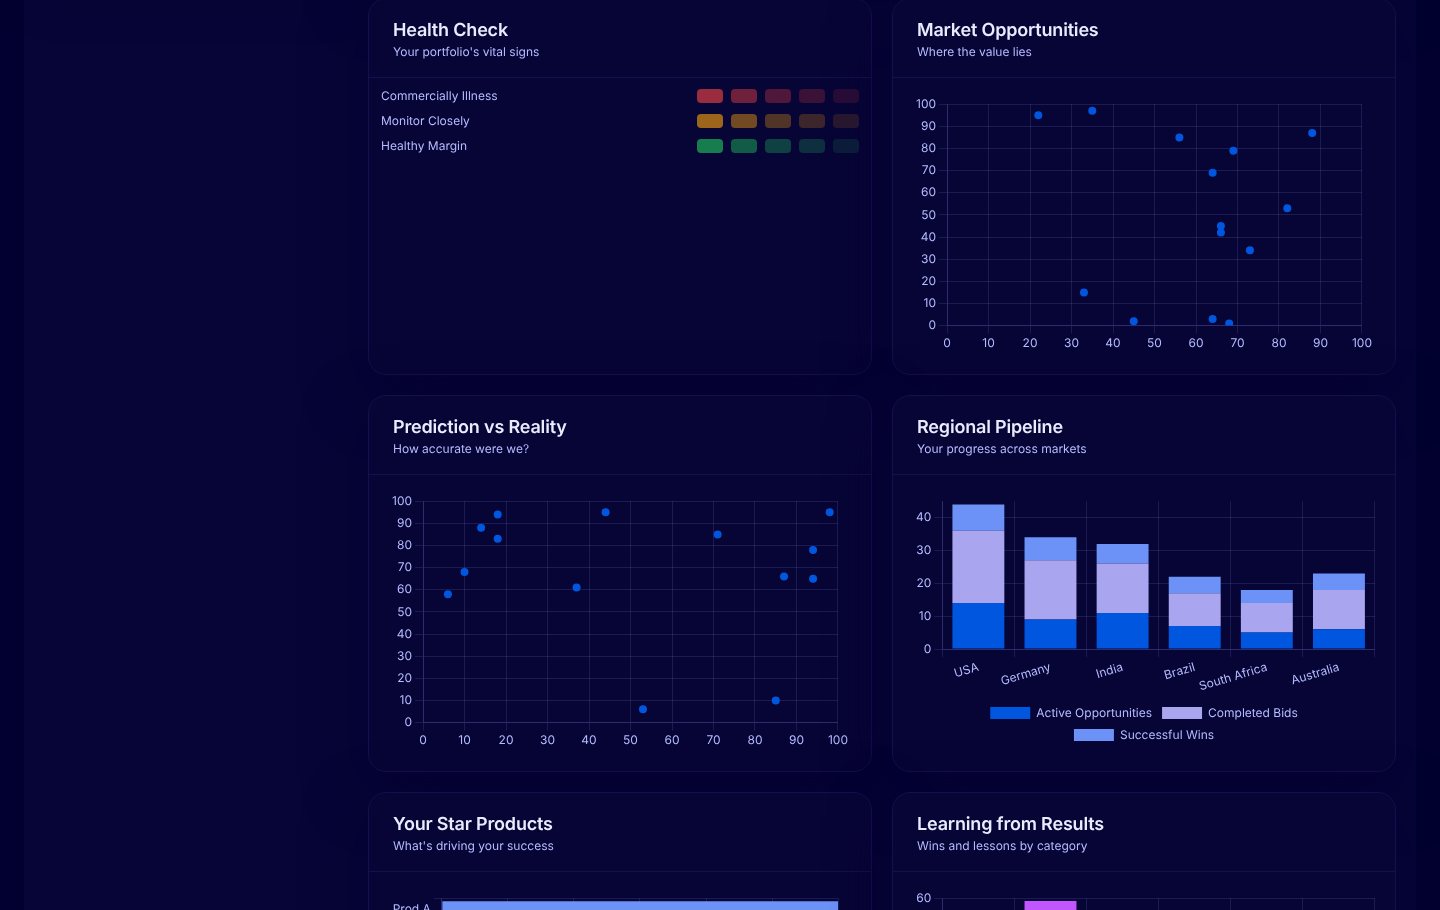
    Plots portfolio health, market value, prediction against result and the regional pipeline
    Health check grid, two scatter plots and a stacked bar chart of the regional pipeline
  3. 03 / 05

    Learn from results

    You
    Compares products, teams and years
    It answers
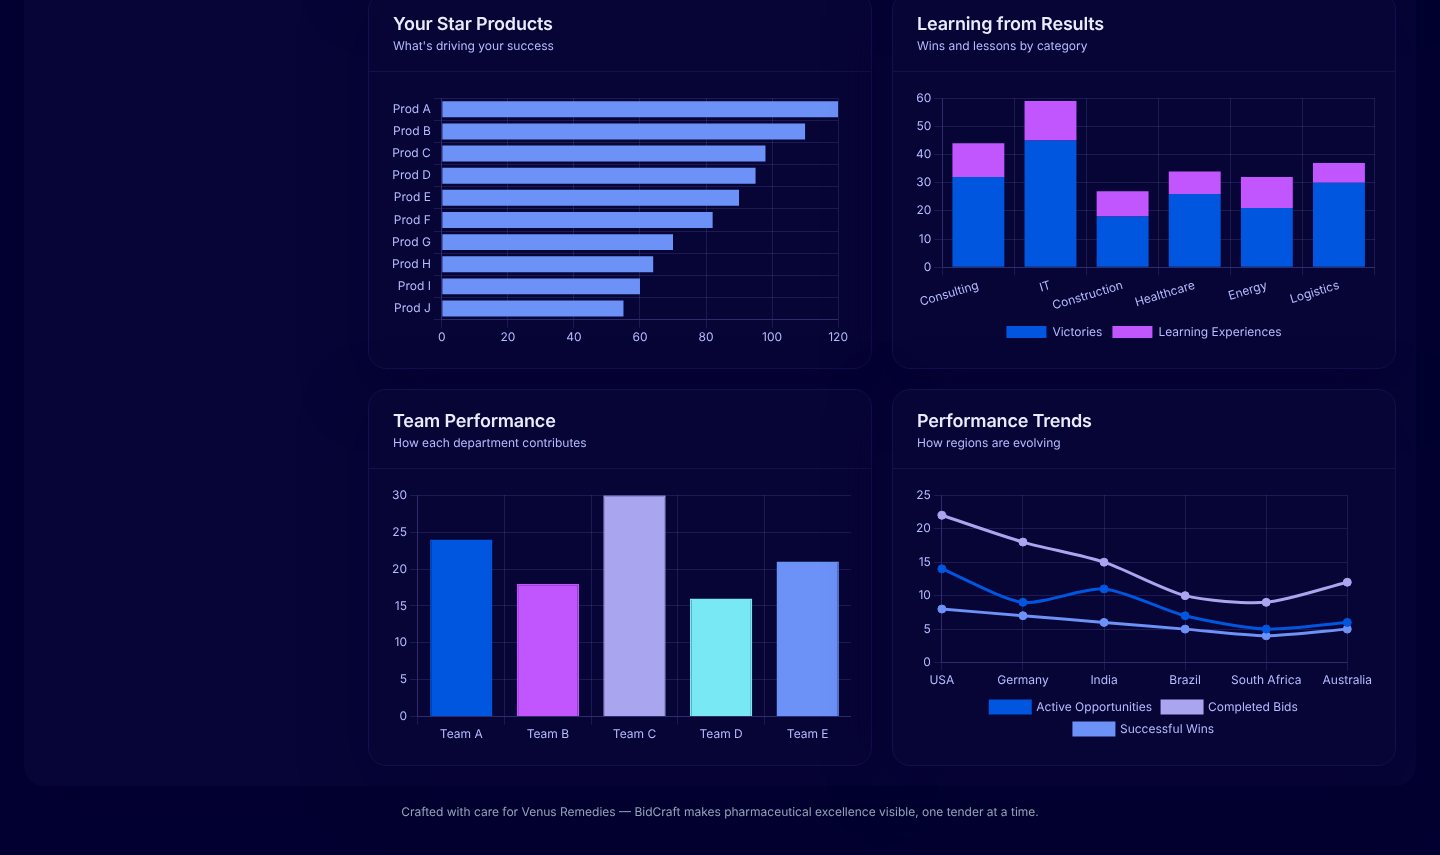
    Ranks products, splits wins from lessons and draws a trend line per region
    Bar charts of top products, wins and lessons by category, team output and regional trends
  4. 04 / 05

    Open the bid history

    You
    Presses Bid History
    It answers
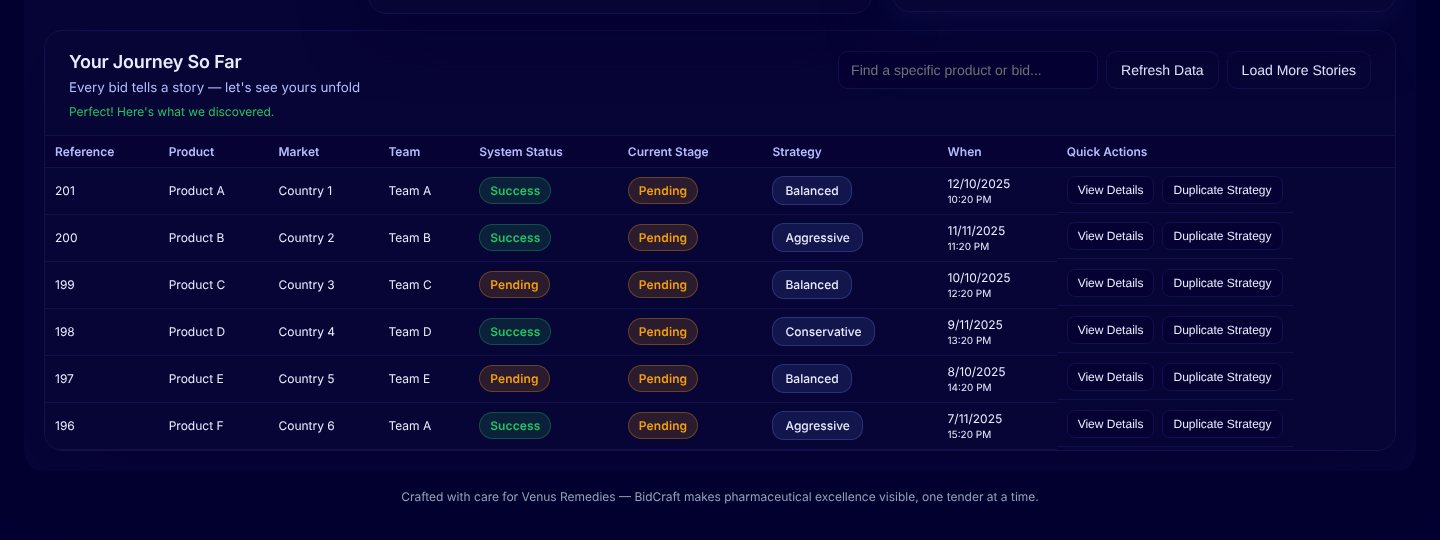
    Lists each bid with its market, team, status, strategy and date
    A table of bids with status badges, a strategy label and View Details buttons
  5. 05 / 05

    Work in the light you like

    You
    Flips the theme switch
    It answers
    Redraws every chart and the map in a light theme
    The same dashboard in a light theme

03 · What was special

What it stands on

  1. A map of win rates

    Win rate by country sits at the centre of the page, so the regional picture comes first.

  2. Works before the backend

    Five API endpoints were specified, and sample data fills every panel until live data connects.

  3. Built on C.L.E.A.R.

    Headings and messages are written in plain, friendly words, in dark and light themes.

One page replaces the hours spent assembling a trend.

Making-Of

BidCraft submitted the bids. The learning was still in the spreadsheets.

The Notion brainstorm entry and the first commit, the same day

  1. The world before

    Bidding and procurement data lived in spreadsheets and scattered reports. Seeing a pattern across regions or products meant hours of manual assembly before anyone could act.

  2. One day

    14 September 2025. BidCraft already handled each bid. The idea was a companion that turns the history into strategy: win rates, a world map and trends.

  3. Because of that

    1. The same day: a dashboard page with summary cards, filters, a world map and eight charts, built frontend-first.
    2. Five API endpoints were written down for the backend team, with sample data as a fallback.
    3. Layout, logo and wording were reworked to the C.L.E.A.R. framework, and a project README was added (14 September).
  4. Until finally

    The dashboard launched as an internal tool, with no public link.

  5. Since then

    The repository holds the page, an API integration guide and the design guide it was built to.

The evidence Process, hands, and artifacts

Process

  1. Origin

    A companion dashboard to BidCraft, frontend-first with sample data

  2. Build

    Cards, filters, world map and charts in HTML, CSS, JavaScript and Chart.js

  3. Contract

    Five API endpoints specified for the backend team

  4. Design pass

    Layout, logo and text revised to the C.L.E.A.R. framework

Hands

Akshansh

  • The idea and the choice of views
  • The API contract
  • Design direction under C.L.E.A.R.

Agents

  • Claude CodeWrote the code he directed