069
Gati
The gait of every trending report the plant still does in Excel.
This reading didn't load. The transcript is below.
Read the transcript


Every trending report at this plant gets built by hand. Someone opens Excel, copies numbers, builds charts cell by cell. That is how the quality review has always been fed.
Gati is the tool I am building to replace it. The name means motion, or gait. The gait of every trending report. The charts are drawn in D three, in the spirit of Giorgia Lupi's data drawing: not the Excel look, but something precise and worth looking at, while every feature the quality review needs stays intact.
I started in September twenty twenty-six, drawing every screen before writing a single line of code. Several decisions are still open. This is a live work in progress, and you are welcome to watch it move.
Narrated in my own cloned voice, generated with ElevenLabs v4.
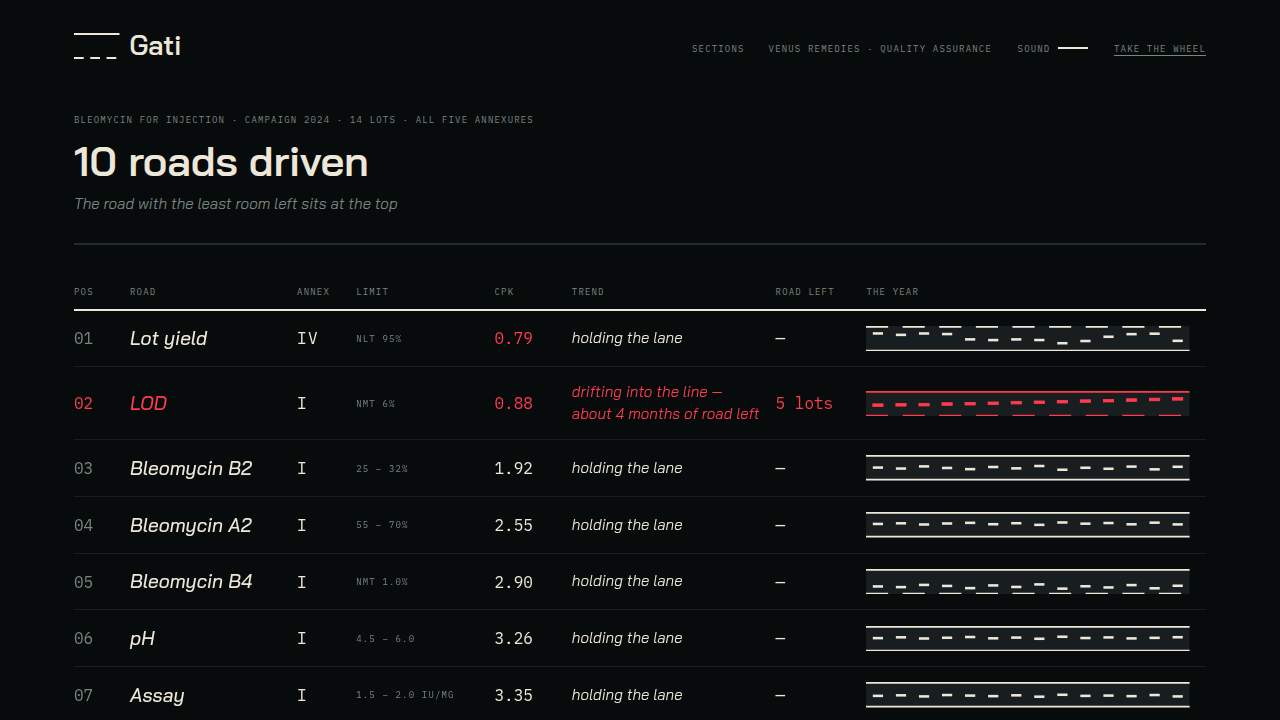
Gati means motion, or gait. The name came from a line that would not leave me: the gait of every trending report the plant still does in Excel.
The plant I work with does its trending reports by hand. Every year, those reports feed the annual product quality review. The work is careful and painstaking. It all happens in spreadsheets.
Gati turns those trends into charts drawn in D3, in the spirit of Giorgia Lupi’s data drawing. The aim is the simplest stunning gait, not the Excel look. Every feature the quality review needs stays.
I started in September 2026, documentation first. The whole product was drawn screen by screen in Paper, a design tool, and reviewed end to end before a line of code was written. Several product decisions are still open. It is better than it was, but it is not complete.
A live, work-in-progress version is up. Built with Next.js, TypeScript, Prisma, and PostgreSQL.
The making
- Next.js
- TypeScript
- Tailwind CSS
- Prisma
- PostgreSQL
- Vitest