Back to the shelf

018

Spine Financial Explorer

An interactive explorer that turns Spine Software Systems' FY 2024-25 financials into a story anyone can read.

Launched · Started October 2025 · Tool · Vibe-Coded

That's the whole thing.

The site's sound is off. The narration still plays.

This reading didn't load. The transcript is below.

Read the transcript

Financial statements live in PDF files and spreadsheets. If you are not trained in accounting, they do not speak to you. That bothered me.

Leadership at Spine Software Systems needed to read the company's financial story for twenty twenty-four to twenty-five without an accounting degree. So I built the Spine Financial Explorer. It takes annual statements and turns them into visual stories. Five levels: Revenue, Growth, Expenses, Profit, and a final Speed Race. Charts, trend lines, and drill-down views surface what the tables bury. Badges and quizzes keep you moving.

I vibe-coded it with AI, starting October twenty twenty-five. The numbers were never the problem. The presentation was. It's launched.

Narrated in my own cloned voice, generated with ElevenLabs v4.

Financial statements sit in PDFs and spreadsheets. If you weren’t trained in accounting, they don’t speak to you. I saw that at Spine Software Systems: leadership, the board, and other stakeholders needed to read the company’s financial story without accounting expertise. The numbers were never the problem; the presentation was.

Spine Financial Explorer takes the FY 2024-25 financial statements and turns them into something you can actually sit with. It’s built for the people who make decisions, not just for the people who run the accounts.

There are five levels: Revenue, Growth, Expenses, Profit, and a final Speed Race. Each one works through the data using interactive charts, trend lines, and drill-down views that surface growth areas, cost drivers, and patterns buried in tables. Badges, streaks, and quizzes keep you moving forward.

I built it with HTML, CSS, JavaScript, and Chart.js, with Python scripts to extract and prepare the data. I built it to my CLEAR framework and vibe-coded it with AI, starting in October 2025.

It’s launched.

The making

  • HTML
  • CSS
  • JavaScript
  • Python

01 · The problem

Before it existed

What hurt

Annual statements sat in PDFs and spreadsheets. Leaders without an accounting background could not read the company’s own story in them.

Who uses it

  • Leadership
  • Board members
  • Stakeholders outside finance
  • 5levels, from revenue to a speed race
  • 7years of figures in the charts
  • 5quizzes, one badge each

02 · The flow

7 steps, in the order they happen

  1. 01 / 07

    Open the explorer

    You
    Opens one page
    It answers
    Shows a score, a streak, a badge count and a progress bar
    Header with the title, a score, a streak and a badge count, above an empty progress bar
  2. 02 / 07

    Answer a quiz

    You
    Picks an answer to a plain-words question
    It answers
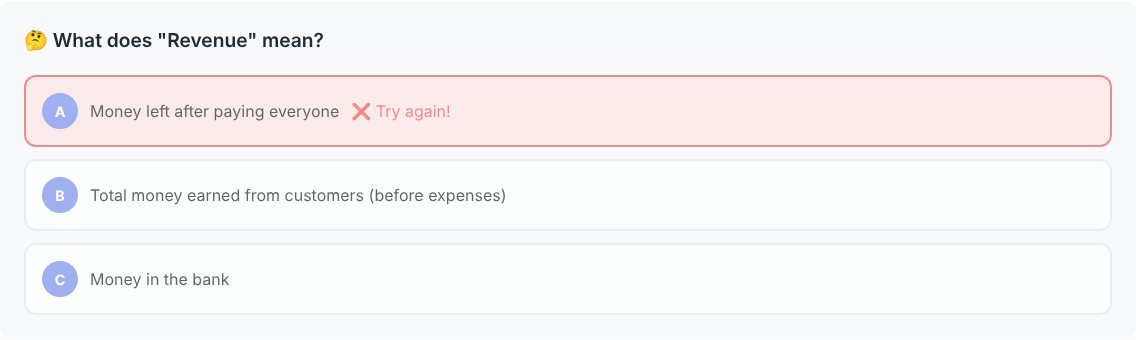
    Marks it right or wrong at once, and awards points and a badge
    A question, what does Revenue mean, with three options and a wrong answer marked in red
  3. 03 / 07

    Watch revenue grow

    You
    Reads the seven-year line
    It answers
    Draws gross and net revenue so the trend is clear before any number
  4. 04 / 07

    See where money goes

    You
    Looks at the cost split
    It answers
    Shows people costs against everything else as a single pie
  5. 05 / 07

    Follow the profit

    You
    Reads income, expenses and what is left
    It answers
    Pairs bars for income and cost with a line for profit
  6. 06 / 07

    Race growth against cost

    You
    Compares two growth rates
    It answers
    Puts revenue growth beside cost growth, year by year
  7. 07 / 07

    Collect the badges

    You
    Finishes the quizzes
    It answers
    Awards a named badge for each lesson learned
    Four green badges, among them Growth Tracker and Profit Detective

03 · What was special

What it stands on

  1. Charts before numbers

    Each level opens with a picture of the trend, then explains it in everyday words.

  2. A quiz at every level

    A short question checks the idea has landed, and right answers build a streak, points and badges.

  3. Built from the statements

    Python scripts read the audited workbook and prepare the figures the charts use.

Financial statements, told as a game anyone can finish.

Making-Of

The numbers were never the problem; the presentation was.

The first commit and the Notion brainstorm, the same day

  1. The world before

    Spine’s FY 2024-25 financials lived in auditor spreadsheets. Anyone outside finance found them opaque, leaders and the board included.

  2. One day

    4 October 2025. The idea was a gamified explorer in five levels: revenue, growth, expenses, profit and a speed race.

  3. Because of that

    1. The same day: the first version, a game-style page built from the audited balance sheet.
    2. Python scripts extracted the figures from the workbook and prepared the data.
    3. Quizzes, a streak, points and badges were added to keep people moving through the levels.
    4. A final round of updates followed the next day (5 October).
  4. Until finally

    The explorer launched, reached by the people who use it.

  5. Since then

    The repository keeps the page, the data scripts, a cheat sheet and a project guide together.

The evidence Process, hands, and artifacts

Process

  1. Origin

    A gamified explorer in five levels instead of a report

  2. Data

    Python scripts extract and prepare the figures from the workbook

  3. Build

    Plotly charts, quizzes, points, streak and badges

  4. Final pass

    Final updates and a start-here guide

Hands

Akshansh

  • The idea of a game, not a report
  • The five-level structure
  • Design direction under C.L.E.A.R.

Agents

  • Claude CodeWrote the page and the data scripts he directed